There's a point where the free tools stop being enough, and it arrives quietly: you've bought the same fund three times at three different prices, DRIP has been reinvesting for months, and one day you realize you can't answer the basic questions anymore. What did I actually pay for all this? What's my real yield on cost? Am I on house money yet? Your broker shows each purchase separately, your memory shows nothing, and tax season is coming either way.
That's the exact job this spreadsheet exists for — the permanent record of lots, reinvested checks, and cost basis that turns "I think I'm doing okay" into numbers.
The Snowball Dividend Tracker is a dividend tracker spreadsheet for Excel and Google Sheets — one $14 purchase, both editions included, no subscription and no account. If your broker's app (Robinhood, Fidelity, Schwab — any of them) only tells you about dividends after they arrive, this is the permanent record that answers everything else: what you collected, what it cost you in taxes, and where the snowball is headed. Here's the full breakdown of what broker apps leave out.
And it fixes the failure every tracker shares: most dividend spreadsheets happily accept typos. Log a quarterly payment where an annual amount should go, and your income numbers are quietly wrong for months. This tracker checks your entries. Every dividend you log is cross-checked against what your holdings should be paying — wrong amounts, future dates, and unknown tickers all get flagged instantly, with the expected amount shown so you can fix it in seconds.
No other dividend template we've seen does this. If you've ever wondered whether your spreadsheet's numbers are actually right — this is the one that tells you.
"Typical" means the pattern across the dividend templates we've reviewed — we name no one, and if you find another sheet that does all of this, we'd honestly like to see it.
| TYPICAL TEMPLATE | SNOWBALL TRACKER | |
|---|---|---|
| Catches a typo'd dividend entry | accepts it silently | flags it with the expected amount |
| Cost basis across multiple buys | usually manual math | merged automatically |
| Prices & names | typed by hand | auto-fill (Sheets edition) |
| Projection math | often annual shortcuts | honest month-by-month compounding |
| Update checker built in | rare | yes — free updates |
The built-in Snowball Projection tab takes your actual portfolio — not a hypothetical — and projects it 1 to 50 years ahead: dividend growth, reinvestment on or off, taxes, and your yearly contributions. It uses the same honest math as our free dividend calculator, applied to the holdings you already track.
Six tabs in each edition:
- Dashboard — portfolio value, income, and yield at a glance, with charts
- Holdings — up to 30 positions: cost basis, gains, yield, yield-on-cost, weight
- Dividend Log — 500 rows with the automatic accuracy checks
- Snowball Projection — your 1–50 year compounding forecast
- Settings — all your assumptions in one place
- Instructions — plain-English quick start (blue cells = you type, black = automatic)
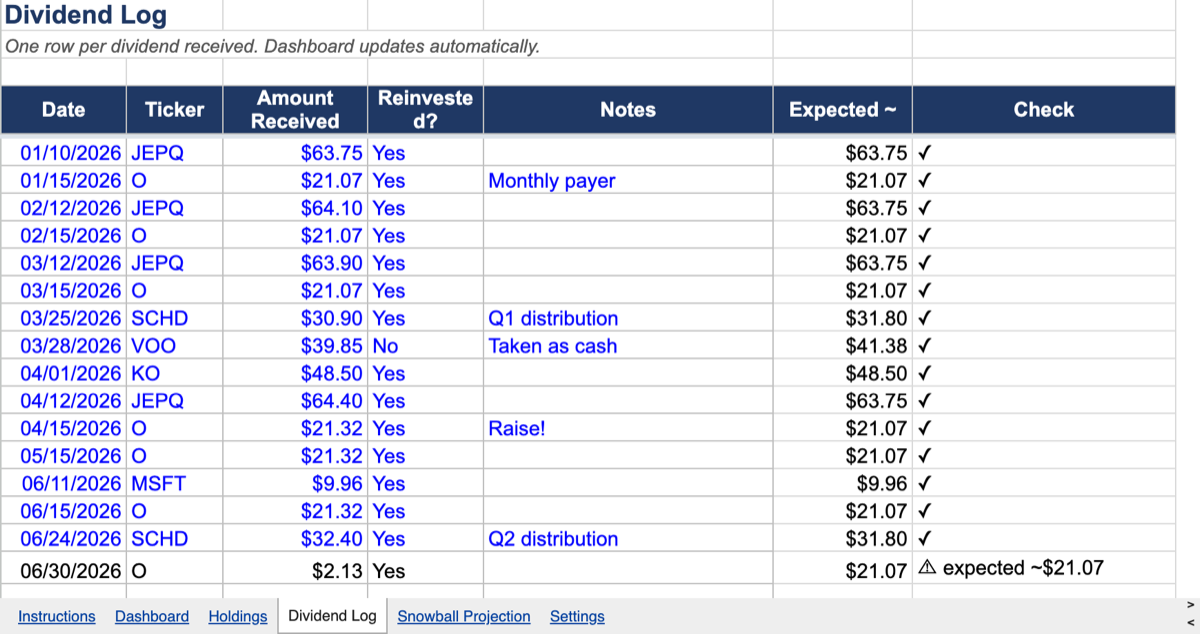
The accuracy check at work: every entry verified, and the $2.13 typo (should be $21.32) flagged instantly with the expected amount.
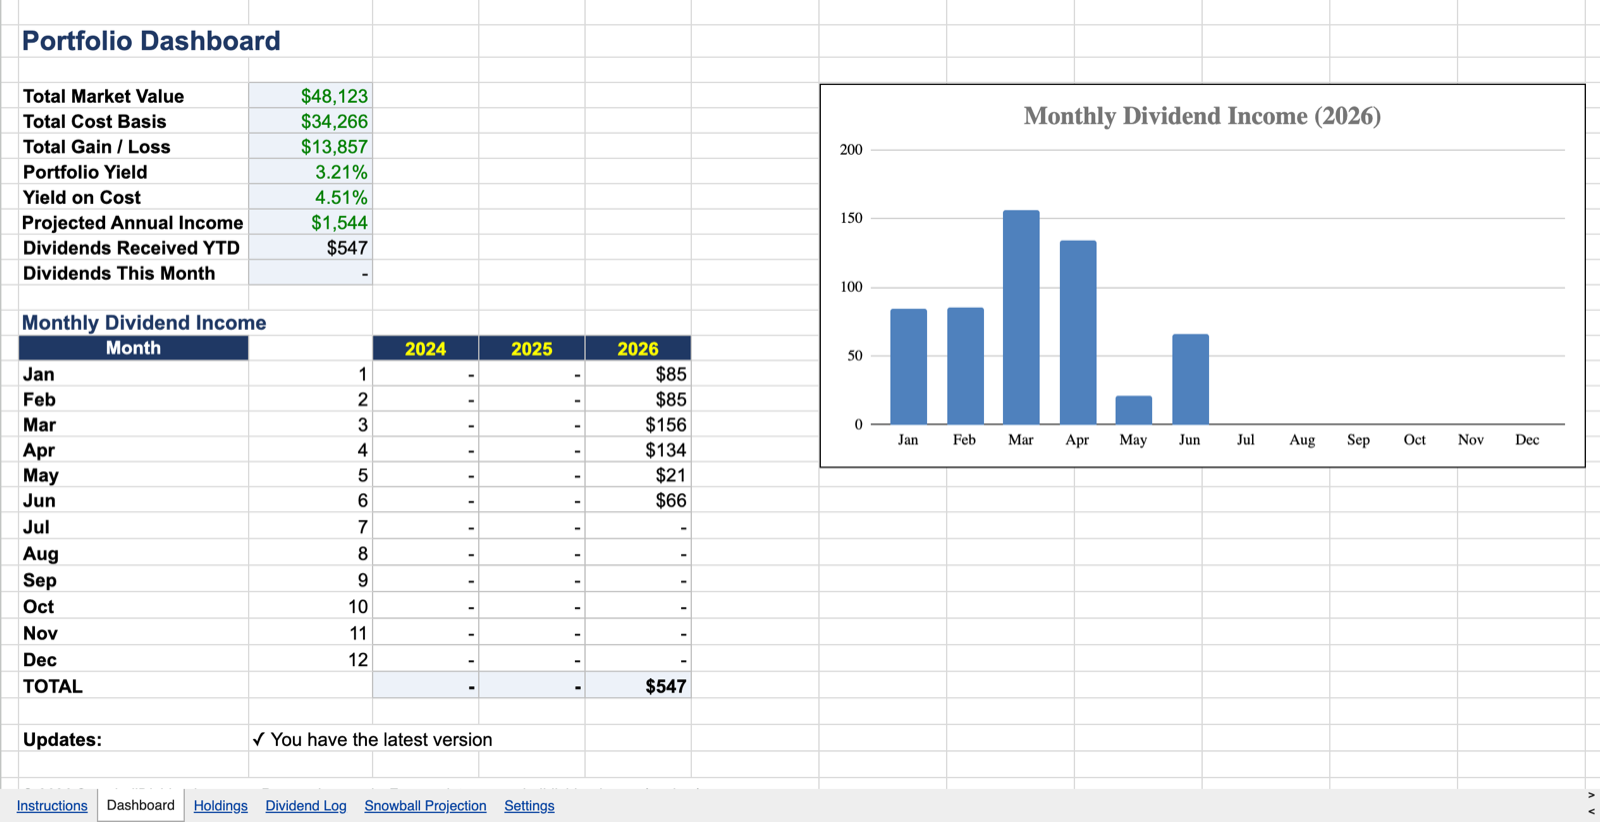
The Dashboard: your whole portfolio at a glance, with monthly income charted — and the built-in update checker.
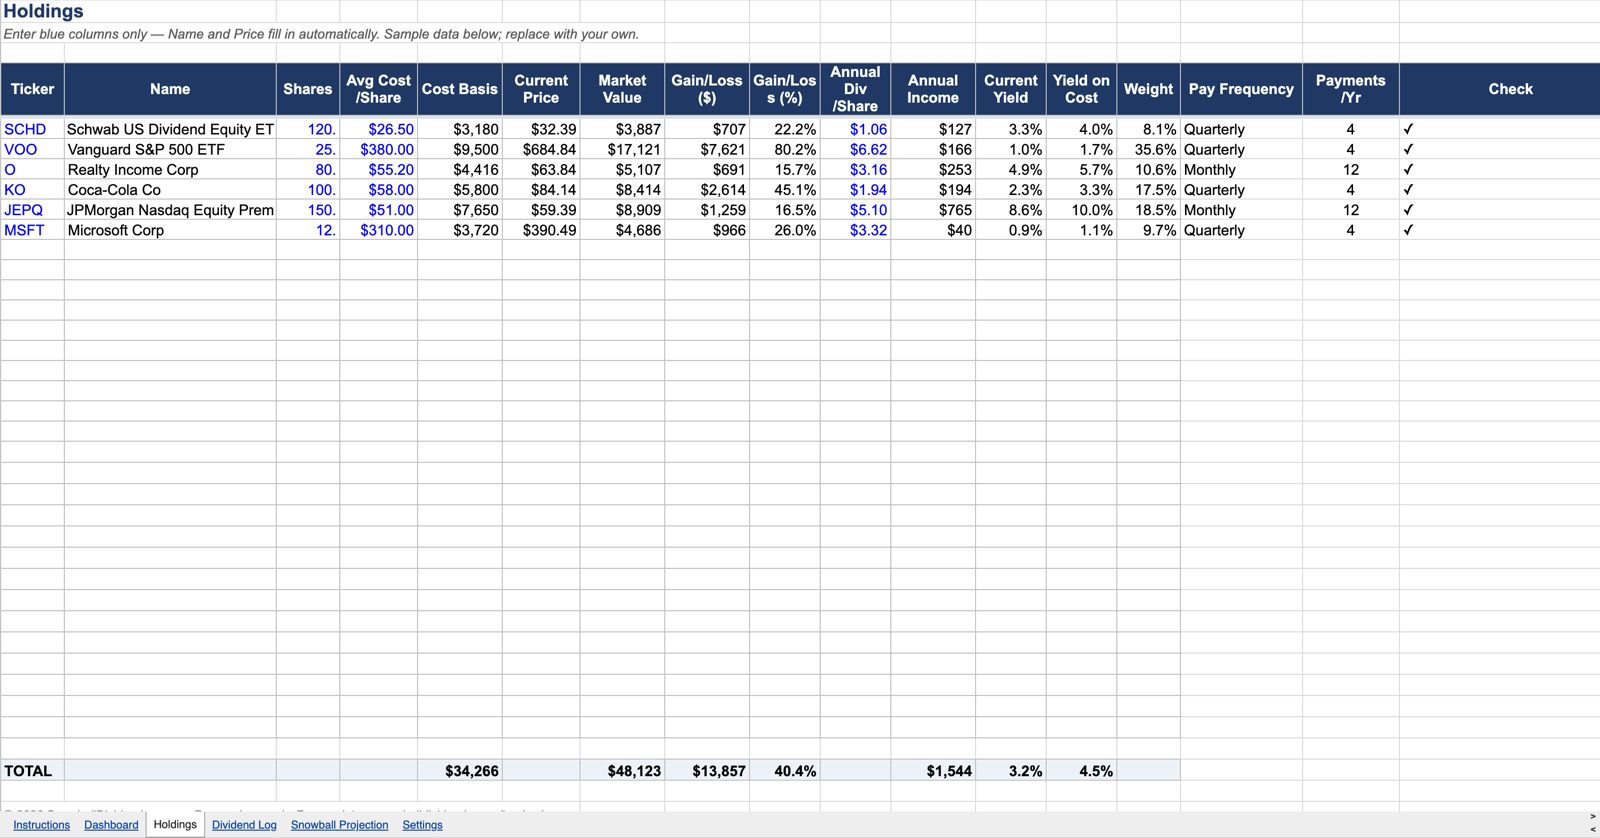
Holdings: type the ticker and your shares — names and live prices fill in automatically (Google Sheets edition).
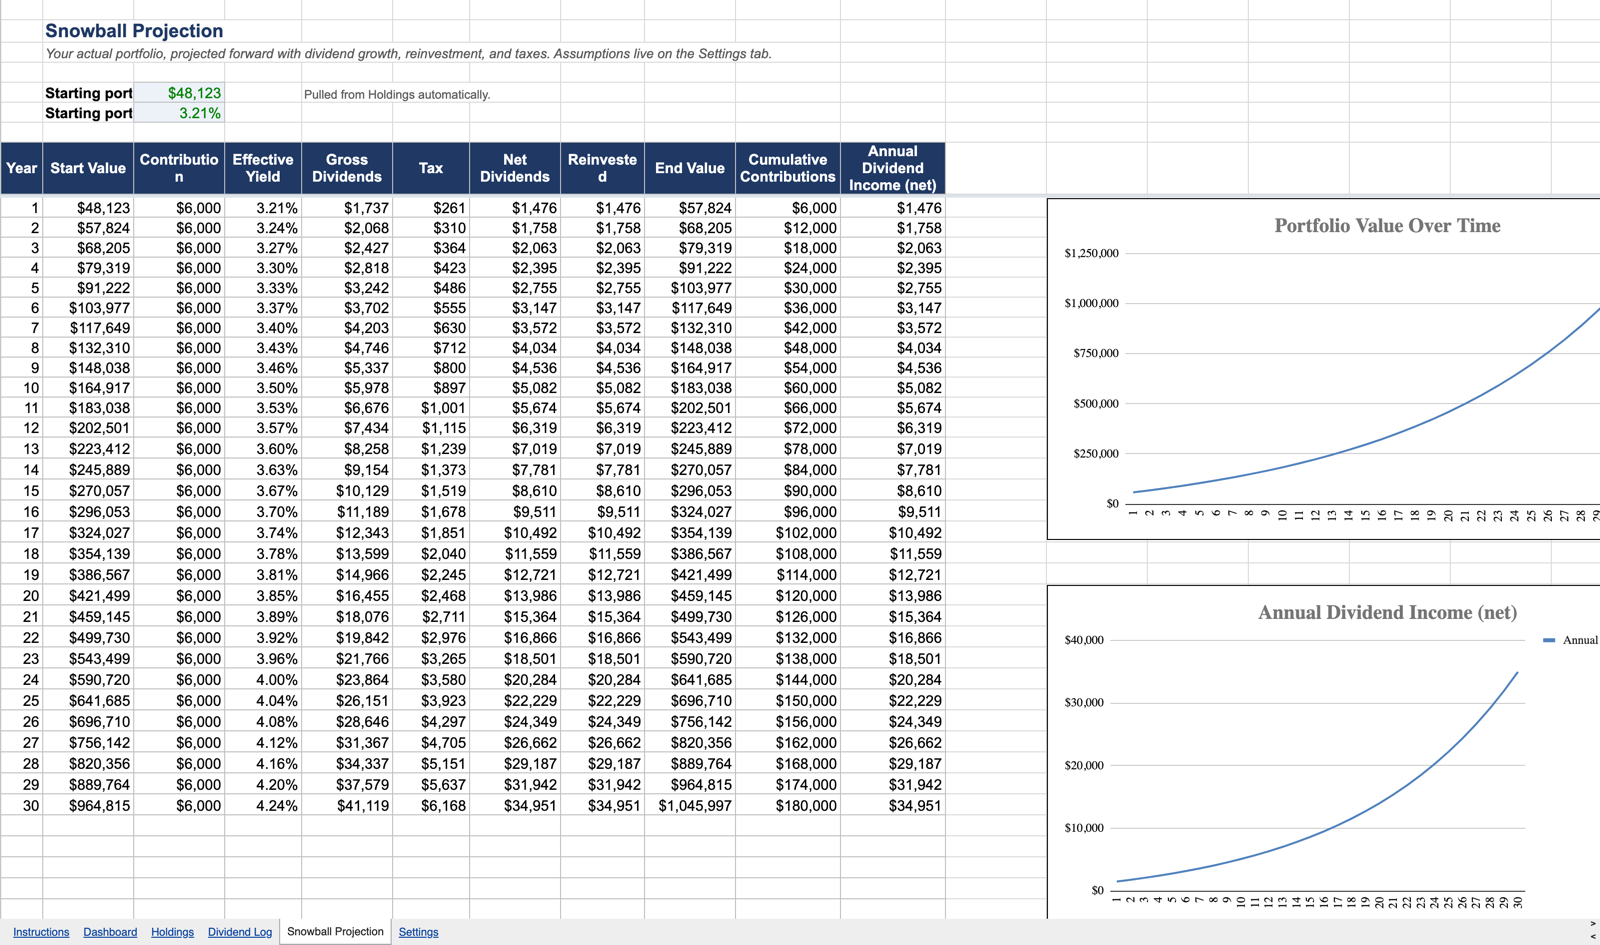
The Snowball Projection: your actual portfolio compounded 1–50 years ahead, with the same honest math as our free calculator.
Instant digital download · both editions included · free updates · macro-free
Simple guarantee: if it doesn't earn its $14 in your first month, reply to your receipt email and we refund it. No forms, no questions.
Personal-use license. Sharing, redistribution, or resale prohibited.
Honest Fine Print
- It's a tracker, not an advisor. It records, checks, and projects — it does not tell you what to buy or sell, and it is not financial advice.
- Designed for US markets and US-listed tickers.
- Google Sheets auto-fetches prices and names (delayed ~20 minutes). Dividend amounts per share are entered by you — Google's finance feed doesn't provide them, and no spreadsheet can fetch them reliably.
- The Excel edition uses manual price entry — the trade-off for working in every Excel version with zero macros.